AWS CloudWatch Omni Brings IDE-Native Observability to AI Agents
New service tackles non-deterministic behavior in agentic systems with built-in evaluators, trace comparison, and unified development-to-production workflow.
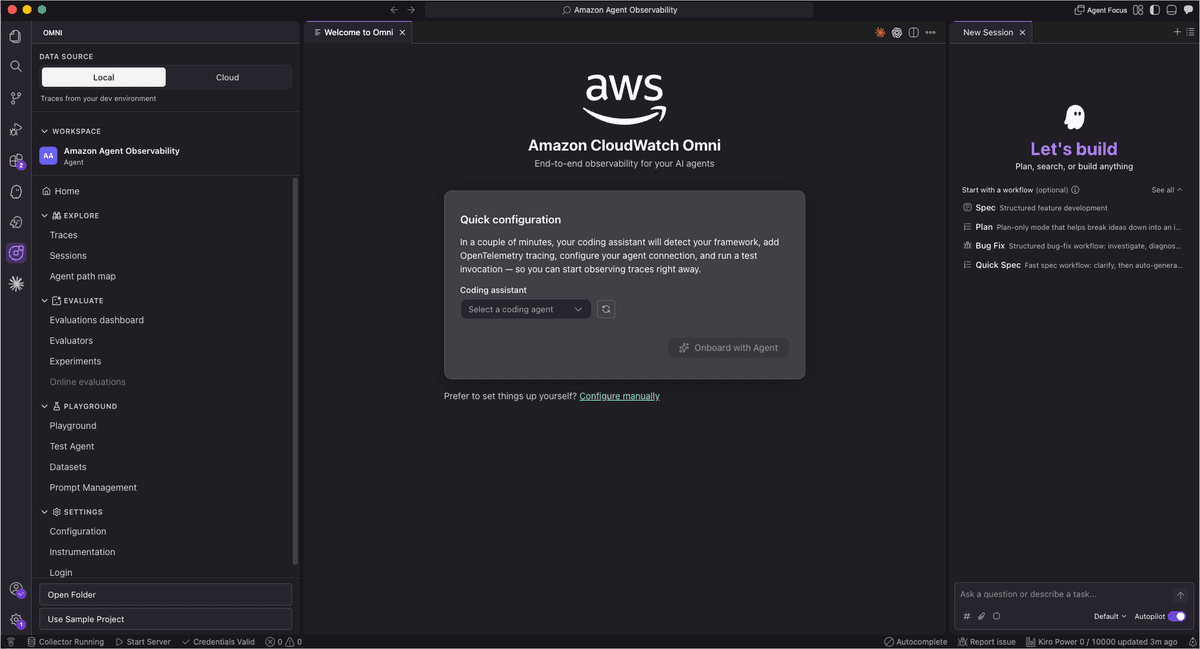
Amazon Web Services has launched CloudWatch Omni, an observability platform designed specifically for AI agents that operates inside developer IDEs and through standalone web interfaces separate from the AWS Management Console.
The service addresses a fundamental challenge in agentic AI: traditional monitoring tools measure latency and error rates but cannot assess whether an agent's response was helpful, coherent, or factually correct. Because agent behavior is non-deterministic, a prompt change can degrade output quality even when standard metrics show no issues.
How CloudWatch Omni works
CloudWatch Omni captures complete traces of every agent decision—tool selections, prompt compositions, and reasoning chains—in a structured timeline. Developers access these traces through native extensions for VS Code and Kiro, while operations teams use a browser-based dashboard accessible via single sign-on without AWS Console credentials. Both surfaces share the same underlying data.
The platform includes 17 built-in evaluators that score responses across dimensions including coherence, helpfulness, faithfulness, and routing correctness. Teams can compare prompt versions side by side in an integrated playground, build test datasets from production traffic, and run experiments across different configurations with automatic regression detection.
Instrumentation relies on open standards—OpenInference and AWS Distro for OpenTelemetry—and supports frameworks teams already use: LangChain, LangGraph, CrewAI, OpenAI SDK, Strands, Vercel AI SDK, and Amazon Bedrock AgentCore. Agents can run on Lambda, ECS, EKS, or other cloud platforms.
Development-to-production workflow
Developers can use CloudWatch Omni entirely locally during development without AWS credentials, then optionally connect to Amazon CloudWatch for persistent storage and team collaboration. The Cloud Login feature bridges local IDE environments and AWS accounts, enabling telemetry sharing and production dashboard access.
The Trace Explorer provides hierarchical views of every agent step with drill-down access to inputs, outputs, token usage, and latency. Compare mode displays two traces side by side to reveal how different prompts or configurations affect behavior. An AI assistant analyzes traces to surface patterns and answer questions about unexpected agent actions.
Additional capabilities include Session Explorer for multi-turn conversation review, Agent Topology visualization for system architecture inspection, and Prompt Management for version control with rollback support. Teams can curate traces into golden datasets for structured experimentation and benchmark creation.
Why it matters
Agentic AI systems make multiple decisions per invocation, creating observability complexity that traditional application monitoring cannot handle. Without visibility into tool selection logic and reasoning chains, teams resort to manual log review across fragmented systems. CloudWatch Omni consolidates agent observability and application monitoring in a single workflow, eliminating context-switching between coding environments and browser dashboards. The eval-driven approach transforms observability from passive monitoring into active quality improvement, letting teams measure what users actually experience rather than just infrastructure health.
Availability and pricing
CloudWatch Omni is generally available now. The IDE extension is free to use and does not require an AWS account. Users need AWS credentials only for Amazon Bedrock models or API keys for providers like OpenAI and Anthropic. Details were first reported by AWS in a blog post by Daniel Abib.
This is an original analysis by the Omega editorial team. Source reporting: AI Watch.
Want systems like this working for your business?
Book a Call